Effective Long Term Investing With Candlestick Charting
Long-Term Investing, the norm for most investor’s investment program. Investing in the stock market long term should produce an average annual return of 10%. Most investors are happy with a 10% annual return. The late 90’s produced inordinate back to back returns for a four year period. This was very unusual. The markets had never produced double digit returns for more than two years in a row throughout the market's history.
But the question that should be asked is whether long-term investing is viable in this day and age. Prior to the past seven to ten years, the vast majority of investment information was disseminated through Wall Street's brokerage community. Long–term investing was the most recommended trading program because the industry professed that you could not effectively time the market. For the professional investor advisor, long-term investing was the safest program to recommend because most so-called investment experts do not have a clue on how to identify timing elements of the markets. Long-term investing became their logical recommendation because all boats will rise over the long term.
Additionally, long-term investing in the stock market is promoted by the tax system, tax rate differentials that make holding positions for longer than twelve months. Think of the fallacy of that line of thinking. Most investors are buying and holding stock positions for their long-term investing portfolio because of an arbitrary time period that a government agency has structured for tax considerations. How often have investors held stocks that were obviously going down because they were not quite to the twelve month holding period? Why would anybody hold a position that they knew was going down? Because the so-called professional investment advisors recommend to do so to save on taxes. As a candlestick investor, knowing when it is time to buy and sell will make tax considerations insignificant. Having a clear visual depiction of trend direction with candlesticks provides a whole new trading mentality for maximizing profits.
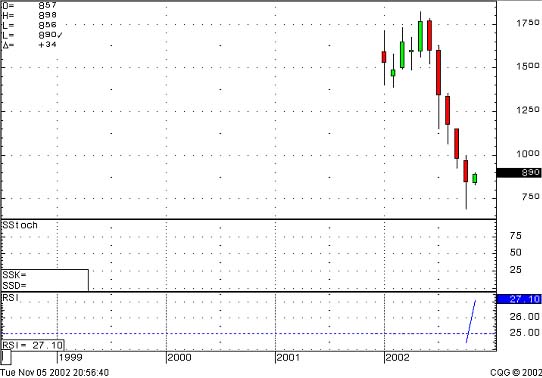
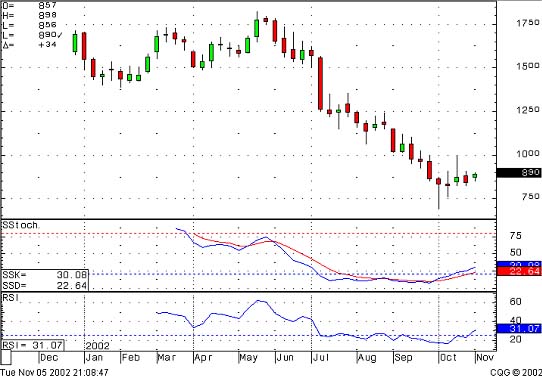
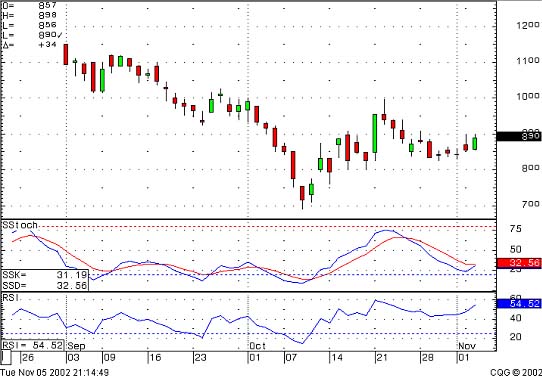
But there are investors who want to do long-term investing. The candlestick signals are an easy profit-producing platform for any length of investing. Long-term investing can utilize multiple time charts for the best long term results. The candlestick charts work as effectively for long-term investing as they do for daytrading and swing trading programs. The combination of daily, weekly and monthly candlestick charts can reveal excellent long term trades and alert the investor of failing trades.

Once it is resolved that the longer term charts warrant looking seriously at establishing a position in a particular stock, looking at the weekly chart reveals what the intermediate time frames look like.

If the weekly chart appears to be bottoming, then the fine-tuning of a long-term trade can be implemented by using the daily charts. Additionally, the failure of a long-term trade can be identified by the same process, using the weekly and daily charts to see if there is weakness in an established position.

The Candlestick Trading Forum is diligently looking for investing positions that accommodate long-term holders.
Whether we are providing long-term investing suggestions or investors are needing analysis of their existing positions, investors should not be hesitant to e-mail Mr. Bigalow and the staff for a candlestick analysis. The basic question should always be, "Do I want to hold a position that I know is going down?" The answer to this question is obviously "No", but the long-term investing program may have periods where holding a stock that is going down can not be helped. However, knowing that a position is going down, other investment strategies can be implemented to profit from that situation without closing the position.
Long-term investing has definite investment strategies that can be greatly enhanced by utilizing the candlestick signals. Basic investment rules can be easily implemented when applying candlestick analysis. "Cut losses short, let profits run" is an easy strategy to use when applying candlestick analysis. Candlestick signals, having hundreds of years of statistical probabilities built into them, gives the investor an immediate advantage. Use this advantage to your benefit. Use the knowledge and experience of the Candlestick Trading Forum to your benefit. Set your targets for 20% returns plus annually.

0 komentar:
Posting Komentar